Stop Opening Every Script to Find a UI Event Listener Hover Instead
Every Unity developer knows this moment: a Button isn’t doing what it’s supposed to, and the only way to find out why is to click through the Inspector, scroll the Persistent listener list, then start grepping the codebase for AddListener calls that might be adding more handlers at runtime. On a UI-heavy project with dozens of Canvases, that search alone can burn twenty minutes.
We built the UI Event Debugger Tool to remove that search entirely. It’s a Scene View overlay for Unity hover over any UI element and its event listeners appear right there, including the ones added dynamically in code that the Inspector never shows you.
What It Actually Shows You
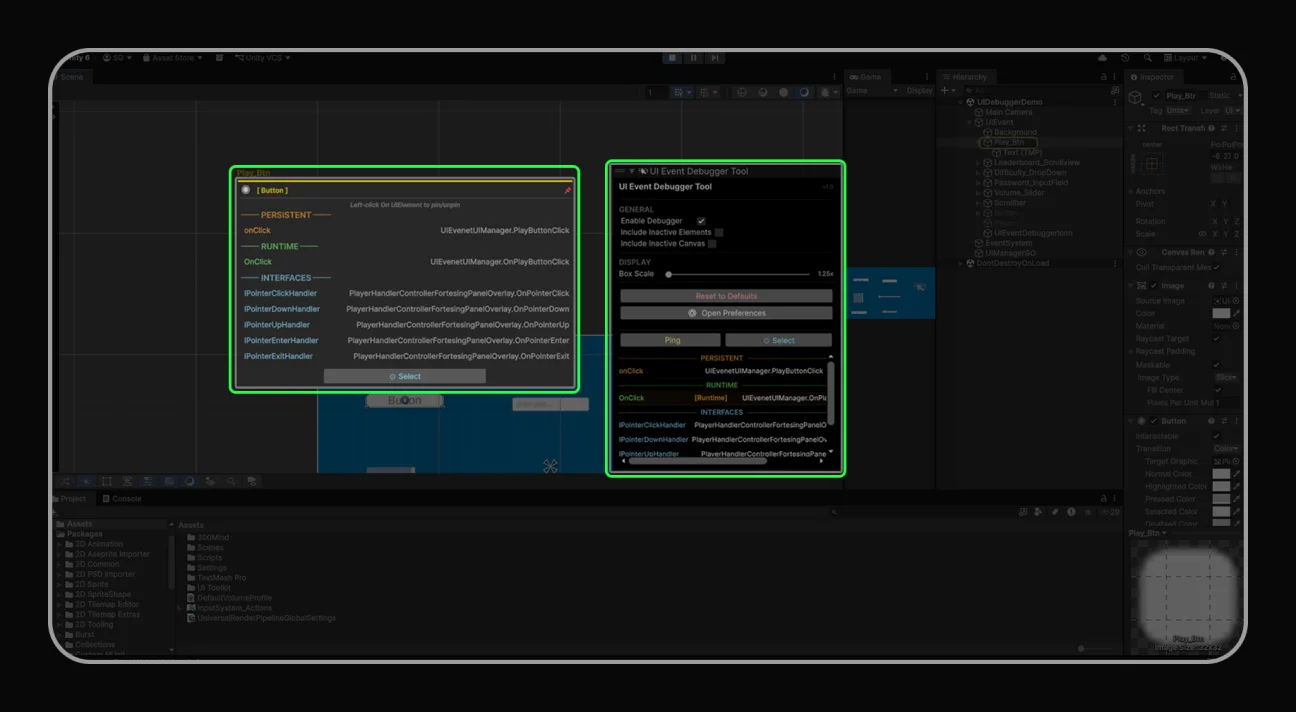
The core interaction is simple: move your mouse over any Button, Toggle, Slider, or other supported UI component in the Scene View, and a floating info box appears next to it, connected by a line back to the element. Left-click to pin that box in place so it stays up while you keep working; the connector line turns cyan to confirm it’s pinned.
What’s actually inside that box is the part that saves the real time:
- Persistent listeners the ones wired up in the Inspector, listed with their target object and method name.
- Runtime listeners anything added in code via AddListener(), which only shows up in Play Mode and never appears in the Inspector at all.
- Interface handlers if a script on the same GameObject implements IPointerClickHandler, IDragHandler, or any of Unity’s other 17 event interfaces, it’s listed in its own section.
Click any method name in that box, and it jumps straight to that method in your IDE. No more manually opening the script and scrolling to find it.
Supported Components
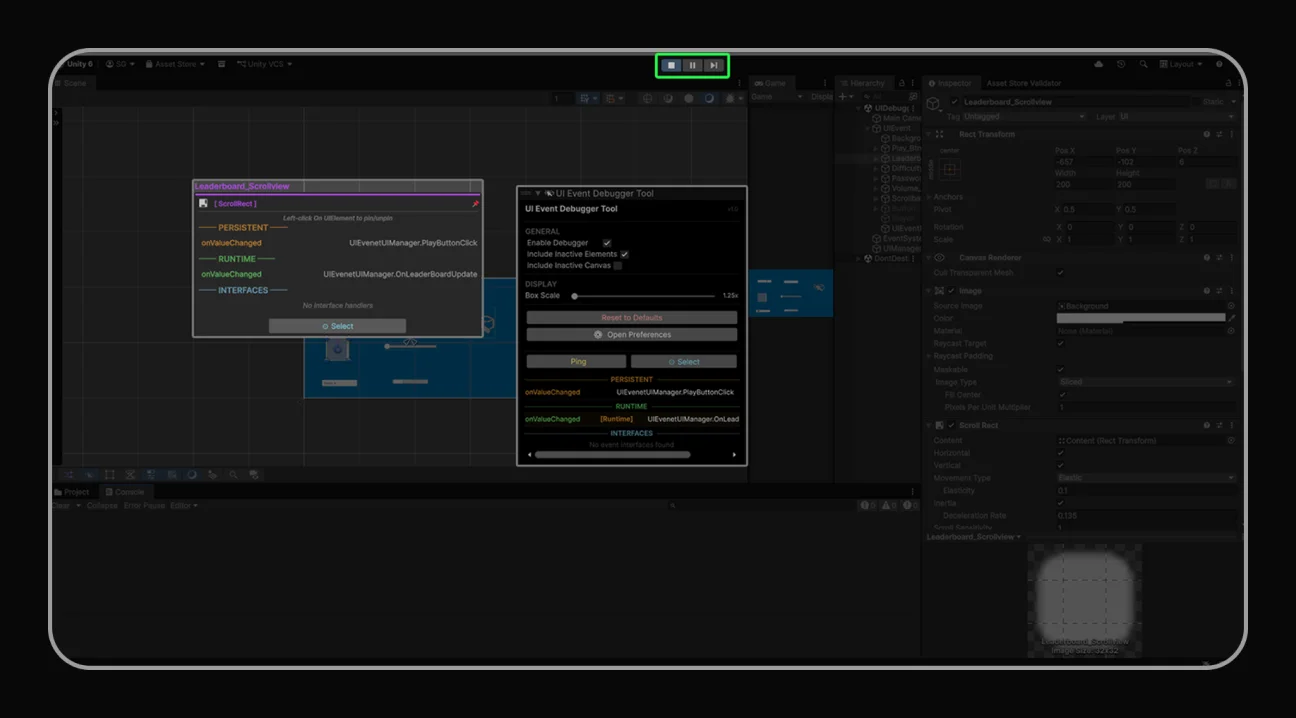
The tool distinguishes standard UGUI components by type, each color-coded so you can tell at a glance what you’re hovering over:
| Component | Events Detected |
| Button | onClick |
| Toggle | onValueChanged |
| Slider | onValueChanged |
| Scrollbar | onValueChanged |
| ScrollRect | onValueChanged |
| InputField (Legacy) | onValueChanged, onEndEdit |
| TMP_InputField | onValueChanged, onEndEdit, onSelect, onDeselect |
| Dropdown (Legacy) | onValueChanged |
| TMP_Dropdown | onValueChanged |
| EventTrigger | All 17 event types |
| Custom IPointer/IDrag | All 17 Unity event interfaces |
Runtime Detection the Feature That Actually Matters
Here’s the gap this tool is really built to close: the Inspector only ever shows persistent listeners the ones you wired up by dragging an object into a UnityEvent slot. Anything added through code at runtime, like a manager script calling AddListener() in Start(), is invisible to the Inspector. It’s also usually the harder bug to track down, because it only exists once you press Play.
In Play Mode, the overlay detects those runtime listeners through reflection and separates them clearly from persistent ones, so you can tell at a glance whether a button’s behavior is coming from Inspector wiring or from code.
void Start()
{
   // This listener appears in the [Runtime] section
   GetComponent<Button>().onClick.AddListener(OnButtonClick);
}

void OnButtonClick()
{
   Debug.Log("Button clicked!");
One honest limitation worth flagging upfront: lambda and anonymous method listeners are detected, but the tool can’t jump to them in your IDE, since there’s no named method to resolve to a file and line. It shows them with a warning instead of silently hiding them, which at least tells you they exist even if it can’t take you there directly.
void Start()
{
    // Lambda listeners show a warning cannot open in IDE
    GetComponent<Button>().onClick.AddListener(() => Debug.Log("Clicked"));
}
Interface Handlers Get Their Own Section
If a script on the same GameObject implements one of Unity’s pointer or drag interfaces directly rather than going through a UnityEvent the tool picks that up too. This matters because a lot of custom input handling in Unity projects skips UnityEvent entirely and implements IPointerClickHandler or IDragHandler straight on a MonoBehaviour, and that logic is otherwise invisible unless you already know to look for it.
using UnityEngine.EventSystems;

public class MyClickHandler : MonoBehaviour, IPointerClickHandler
{
    public void OnPointerClick(PointerEventData eventData)
    {
        Debug.Log("Pointer clicked!");
    }
}
Worth noting: built-in Unity components don’t show interface entries only your own custom scripts do, since that’s where this kind of handler actually gets implemented.
Overlay and Preferences What You Can Tune
The overlay panel itself sits at the bottom of the Scene View once enabled, with a small set of settings that control what gets scanned and how big the floating box renders:
| Setting | Description | Range | Default |
| Enable Debugger | Turn the tool on/off | on/off | on |
| Include Inactive | Scan inactive GameObjects | on/off | off |
| Include Inactive Canvas | Scan inactive parent canvas | on/off | off |
| Box Scale | Floating box size | 0.5x 2 | 1x |
eyond the overlay, there’s a separate Preferences window (Tools → UI Event Debugger Tool → Preferences) with custom colors per component type, three preset themes (Default, Pastel, High Contrast), and export options event reports can be pulled as .txt, .csv, or .json, which is handy if you want a static reference of every event binding across a scene for documentation or a code review.
Getting It Running
Install is standard Package Manager flow: open Window → Package Manager, switch the category dropdown to Packages: My Assets, find UI Event Debugger Tool, and hit Download then Import. The overlay panel appears at the bottom of the Scene View automatically no extra setup step.
- Make sure your scene has a Canvas with at least one UI element.
- Enable the overlay: Scene View → Overlays menu → UIEventDebuggerTool → Enable.
- Hover over any Button, Toggle, or other supported element the floating info box appears automatically.
- Left-click to pin an element; right-click the same element (or empty space) to unpin.
- Click any method name in the box to jump straight to it in your IDE.
If the floating box doesn’t appear on hover, the most common cause is a missing GraphicRaycaster on the Canvas the tool relies on the same raycasting Unity’s own UI input system uses, so without it there’s nothing for the overlay to detect.
What It Doesn’t Do (On Purpose)
A few scope boundaries are worth being upfront about, since they’ll save you a support ticket:
- It targets UGUI (UnityEngine.UI) components specifically UI Toolkit (UIElements) runtime events aren’t currently supported.
- It reads standard UnityEvent and UnityEvent types; fully custom event systems that don’t inherit from UnityEventBase won’t be picked up.
- All of it lives in Editor-only assemblies, so none of it ships in a build zero impact on build size or runtime performance in a shipped game.
Why We Built It as an Editor-Only Overlay
The instinct with a lot of debug tooling is to make it available at runtime in builds too, in case you need to debug a live issue. We deliberately didn’t do that here this tool exists to solve an editor-time problem (finding what’s wired to what while you’re building the UI), and keeping it entirely in Editor-only assemblies means it has zero footprint in anything you ship. You get the full debugging power during development without ever having to think about stripping it out before a release build.
Get the UI Event Debugger Tool
Live now on the Unity Asset Store built for any UGUI project where tracking down event wiring is eating your debugging time.
Building in Unreal or Blender instead? Browse our full catalog: